Using a trend line on a set of plotted data is a very important tool in many subjects. Google Spreadsheets can simulate this but it is not a smooth process yet. Instead we can use LibreOffice to add a trend line to our data.
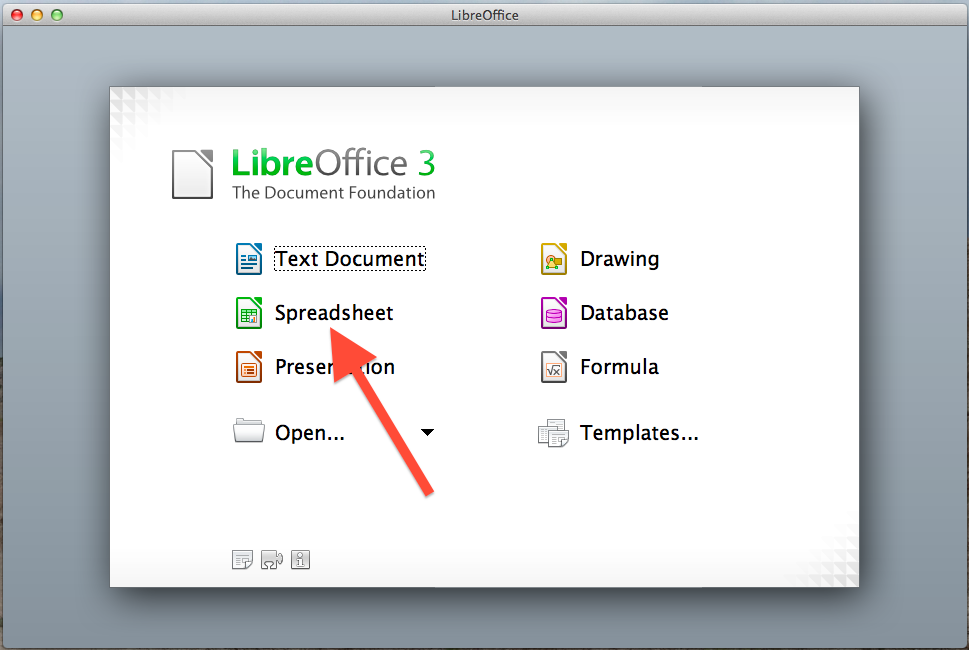
1. Open up LibreOffice and select the Spreadsheets option.
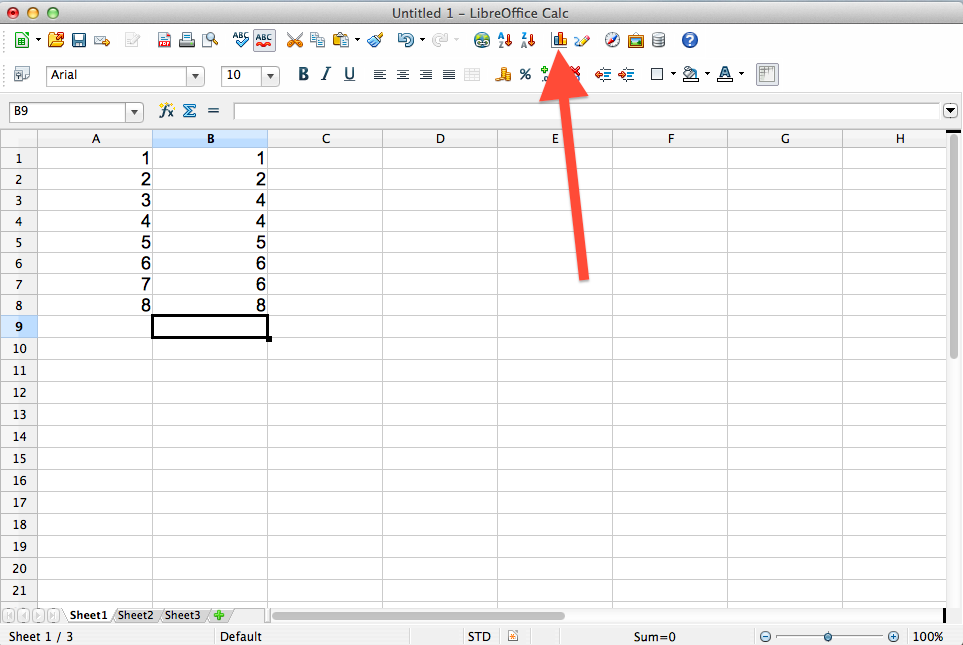
2. Enter your data and then select the graphing tool.
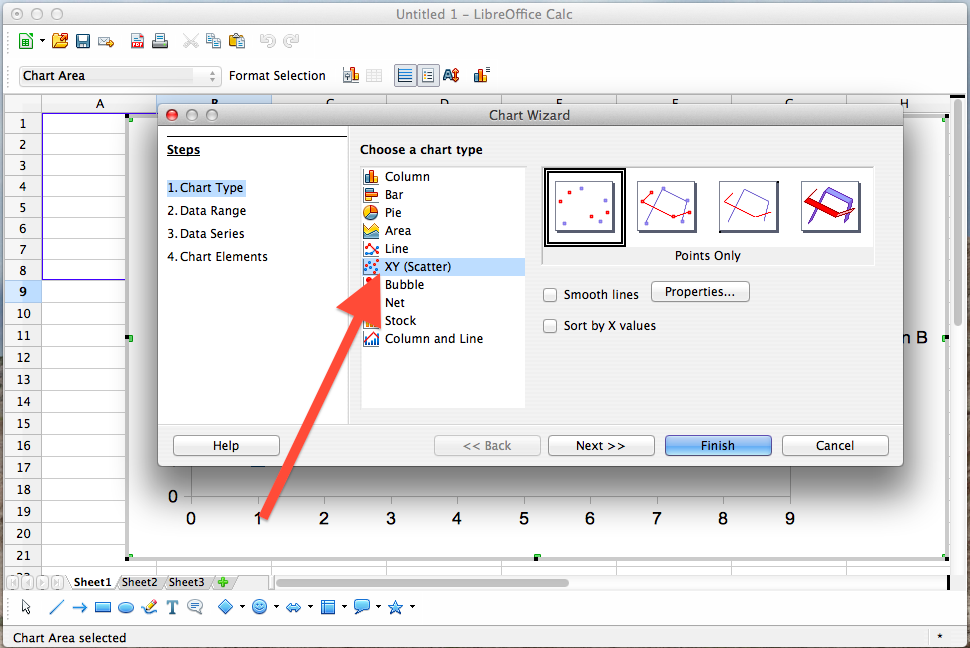
3. For plain data plotting I would select the XY (Scatter) plot.
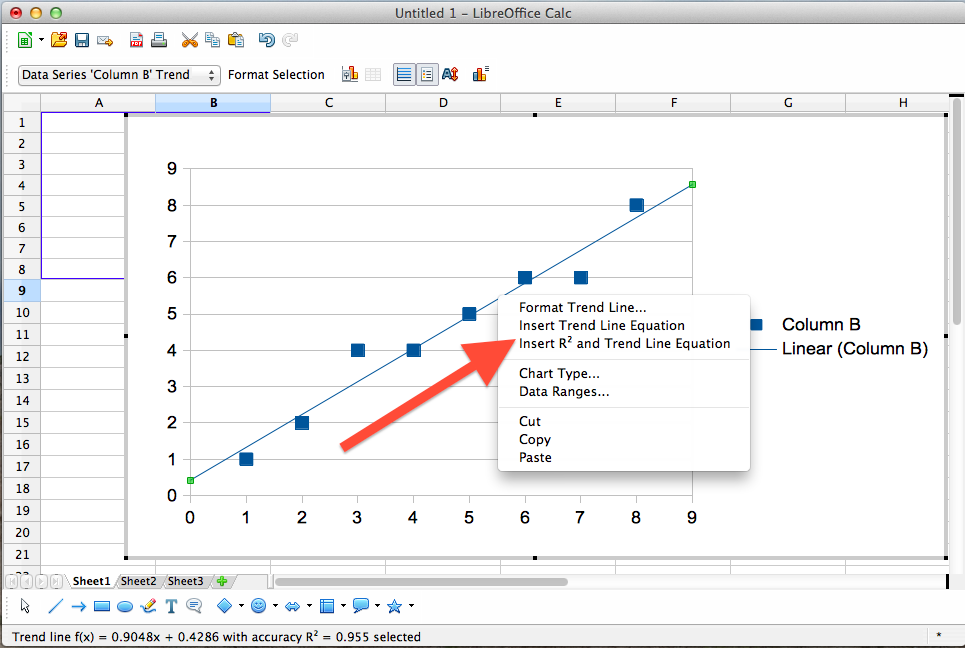
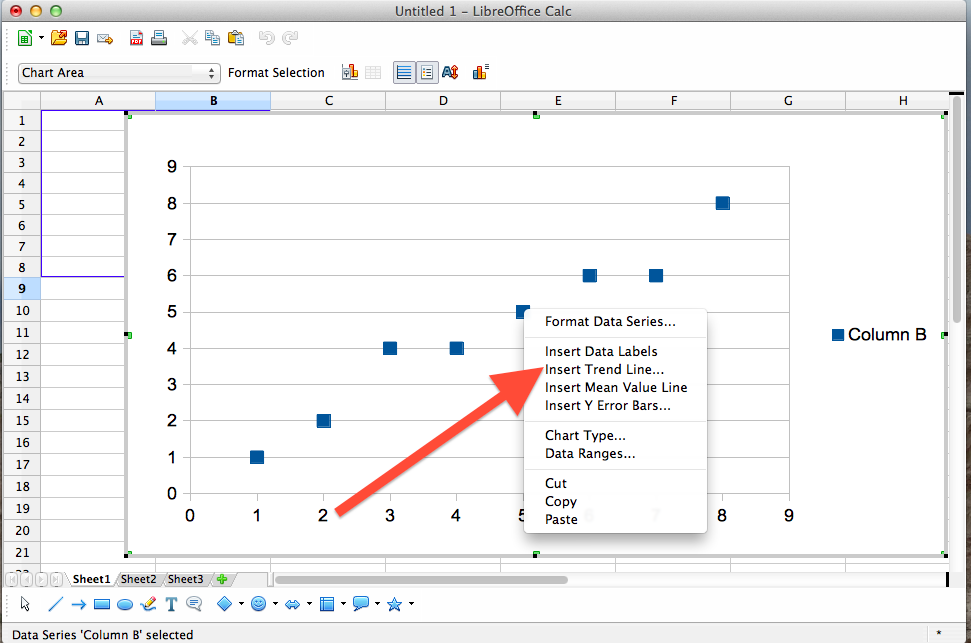
4. After you select the rest of your graphing options the graph will be created. Right click the data on the graph and you should see “Insert Trend Line…” as an option.
5. A trend line will be adding to your plot. You can then right click the line and get another set of options. Here you can format the trend line, insert the equation for the line and even add the R2 value.